The Bitcoin (BTC) price is breaking down from an ascending support trend line while the Crypto Market Cap (TOTALCAP) still trades above support. MINA fell after its yearly high.
In the news today:
- A recent report noted there were 103 million in net inflows in the cryptocurrency market last week.
- Sotheby’s reported that the 2023 high for a digital arts sale was $6.2 million. A live auction netted $12 million.
TOTALCAP Falls After Yearly High
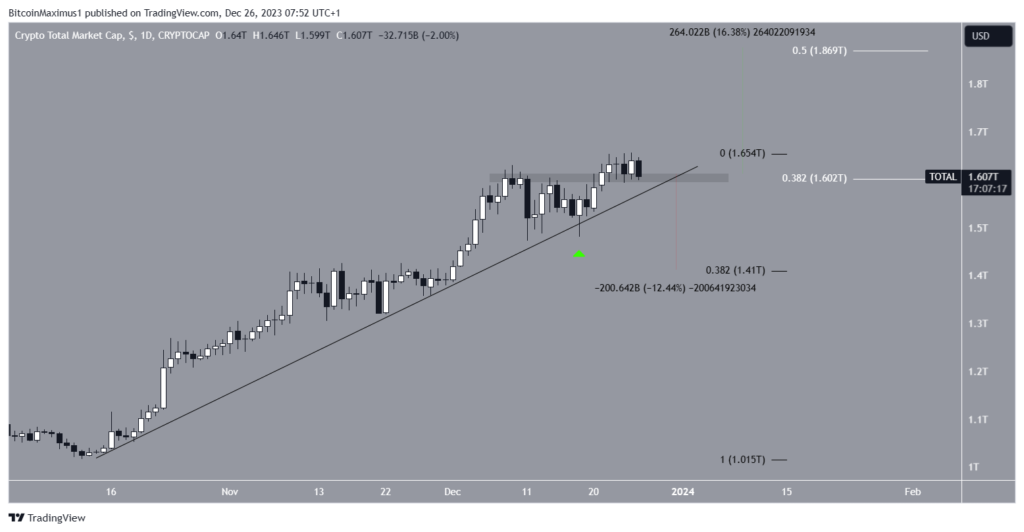
The cryptocurrency market cap has increased alongside an ascending support trend line since October. Recently, it bounced at the trend line on December 18 (green icon) and began an upward movement.
The bounce led to a new yearly high of $1.66 trillion on December 26, causing a breakout from a critical horizontal and Fib resistance area at $1.60 trillion.
However, TOTALCAP fell sharply yesterday and returned to the $1.60 trillion area again. Whether it bounces or breaks down will likely determine the future trend.

A strong bounce can lead to a 16% increase to the next resistance at $1.87 trillion, while a breakdown could cause a 12% drop to the 0.382 Fib retracement support at $1.41 trillion. This will also cause a breakdown from the ascending support trend line.
Read More: 9 Best AI Crypto Trading Bots to Maximize Your Profits
Bitcoin Falls Below Support Trend Line
Similar to TOTALCAP, the BTC price has increased alongside an ascending support trend line since October. However, the December 18 bounce (green icon) in Bitcoin did not lead to a new yearly high. Rather, it created a lower high on December 22.
The price has fallen since and is breaking down from the ascending support trend line.
If Bitcoin closes below the trend line, it can decrease by 12% to the next closest support at $37,800. This would confirm a deviation above a long-term horizontal and Fib resistance at $42,300.

Despite this bearish BTC price prediction, a strong bounce at the trend line can initiate a 14% increase to the next resistance at $48,600.
Read More: 9 Best Crypto Demo Accounts For Trading
MINA Fails to Sustain Breakout
The MINA price has increased swiftly since December 18. The upward movement caused a breakout from the $0.90 resistance area, leading to a new yearly high of $1.32 on December 25 (red icon).
While this initially caused a movement above the $1.20 resistance area, the price could not sustain its increase. Rather, it created a long upper wick and fell sharply afterward. This turned the previous breakout into a deviation.
If the price continues moving downwards, it can fall by 20% and reach the $0.90 area again.

Despite this bearish MINA price prediction, reclaiming the $1.20 area can trigger an 85% increase to the next resistance at $2.
Read More: Best Upcoming Airdrops in 2023
For BeInCrypto‘s latest crypto market analysis, click here.
Best crypto platforms in Europe | January 2024
![]()
KuCoin
Explore →
![]()
Wirex App
Explore →
![]()
YouHodler
Explore →
![]()
Margex
Explore →
Explore more
The post Why Is the Crypto Market Down Today? appeared first on BeInCrypto.


