ONDO has seen a significant 15% rally following Bitcoin’s rise to $69,500, with a 19% price increase since the start of the week.
Over the last two days, Ondo (ONDO) has experienced a remarkable surge in on-chain activity, signaling a potential bullish trend.
ONDO Surges on Bullish Bitcoin Price Action
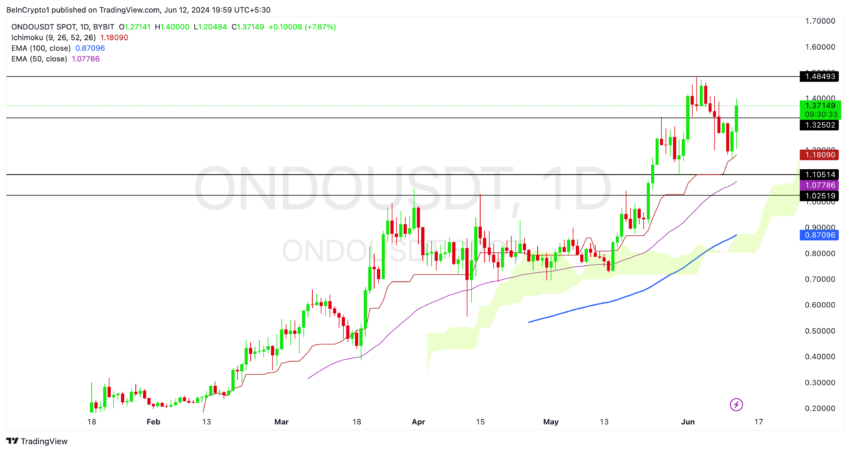
ONDO has registered a significant 15% rally following Bitcoin’s surge to $69,500. Notably, ONDO’s price has increased by 19% since the beginning of the week. Upon examining the daily chart, it is clear that ONDO has established a support level at $1.17, testing the Ichimoku baseline (red).
The Ichimoku baseline, a critical indicator for forecasting price movements, acts as both support and resistance. A test of this baseline is typically considered a reversal signal.
At present, ONDO is trading 58% above its 100-day exponential moving average (EMA, in Blue), a strong bullish indicator. Importantly, the 100 EMA has not exhibited any flattening trend despite ONDO undergoing a 21% price correction from its all-time high of $1.48 down to $1.17.
Read More: Learn more about Real-World Assets (RWA) as ONDO positions itself as an RWA project.

The fact that the EMA has remained steady, coupled with the price action above the baseline, suggests that ONDO is poised to continue its upward trajectory towards its all-time high.
If ONDO falls back below the Ichimoku baseline shown in red, it could signal a bearish trend for the price. Placing stop losses below this level could be a prudent strategy to mitigate risks when trading similarly high-volatility cryptocurrencies.
Key On-Chain Indicators Signal Bullish Momentum
The last two days saw a significant rise in on-chain activity for the Ondo token.
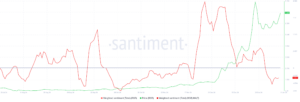
Key indicators such as Unique Receivers (Receiving Addresses) and Transfer Amounts have notably increased. This uptick suggests growing interest and engagement with the token, potentially signaling a shift in market dynamics or investor sentiment.
Taking a closer look at the unique receivers reveals that more addresses have been receiving ONDO during these last two days. This could indicate expanding adoption and demand. The increase in unique receivers is a positive sign, suggesting that the token is gaining traction and attracting a broader user base.
The spike observed in unique receivers (June 4), which reached 2,600, was a clear indicator of the token’s price surge. Monitoring this indicator is crucial for identifying potential long positions on ONDO.
Read More: Ondo (ONDO) Price Prediction

Similarly, the transfer amounts have increased (Blue bars), indicating higher transaction volumes. This could be due to larger individual transactions or an overall increase in the number of transactions.
Higher transfer amounts often reflect greater liquidity and market activity, which can be driven by positive news, developments, or speculative trading. These trends suggest a bullish sentiment among investors, highlighting the importance of monitoring these indicators for future market insights.
The observed trends indicate a bullish outlook for the ONDO token, suggesting that the price could reach its all-time high of $1.48 sooner than anticipated.
ONDO’s Price Prediction: During its all-time high, ONDO’s market cap reached $2 billion. If ONDO continues to break its all-time high, the market cap could target $2.5 billion, aligning with a 25% price appreciation from the all-time high, making $1.88 a potential take profit mark. A further target is a $3 billion market cap, a 50% increase, making $2.30 an additional take profit level for long-term holders.
The post ONDO Price Prediction: All-Time High on the Horizon appeared first on BeInCrypto.


