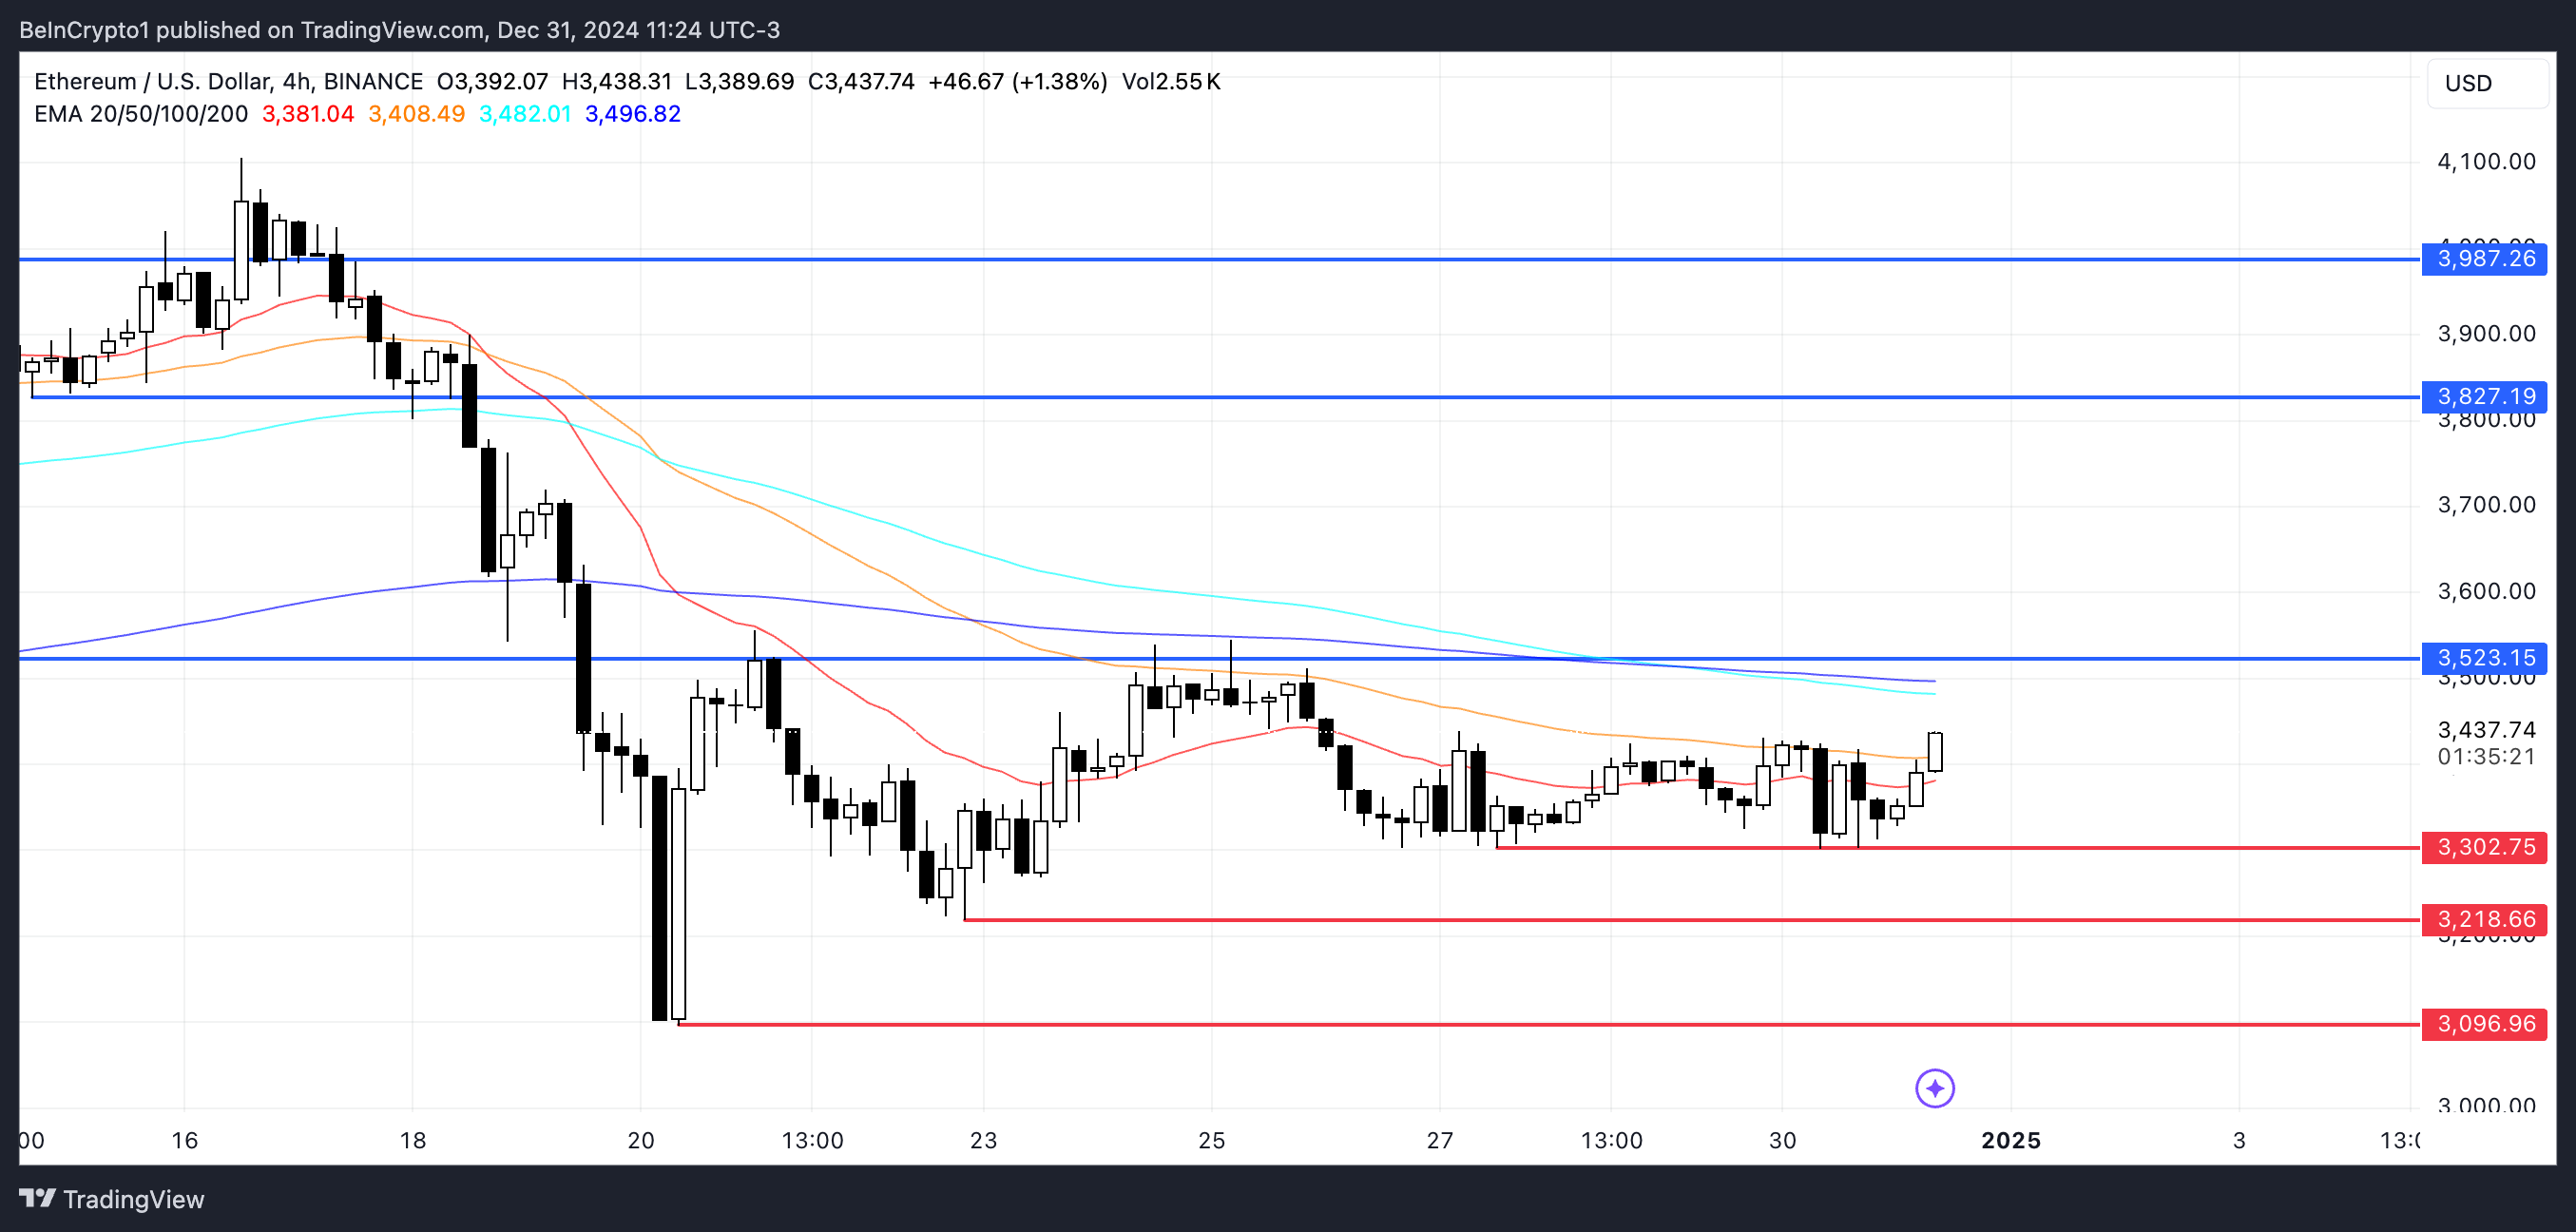
Ethereum (ETH) price is up over 3% in the last 24 hours, showing signs of recovery as the year ends. Unlike Solana and Bitcoin, which reached new all-time highs in 2024, ETH fell short of achieving this milestone.
Key indicators like RSI and DMI suggest that bullish momentum is building, with ETH nearing a critical resistance at $3,523. Whether the altcoin can break higher or retest lower support levels will define its short-term price trajectory.
ETH RSI Is Going Up
Ethereum Relative Strength Index (RSI) is currently at 56.2, reflecting a steady recovery after dropping below 20 on December 20. This rebound indicates that buying pressure has gradually returned, lifting ETH out of oversold conditions and into a neutral-to-slightly-bullish zone.
An RSI of 56.2 suggests that momentum is leaning more toward the positive side, signaling the possibility of a mild upward movement in the ETH price as it stabilizes.

The RSI is a momentum indicator that measures the speed and strength of price movements on a scale from 0 to 100. Values above 70 indicate overbought conditions, often signaling a potential price pullback, while values below 30 suggest oversold conditions, hinting at a possible recovery.
With Ethereum RSI at 56.2, it remains in a neutral zone but is close to entering bullish territory. In the short term, this could mean ETH has room for moderate gains, although a lack of strong momentum might limit significant upward movement unless buying pressure intensifies further.
Ethereum DMI Hints at Bullish Shift
ETH DMI chart indicates that its ADX is currently at 12.8, remaining below 20 since December 27. This low ADX reading suggests that the trend strength is weak, reflecting a lack of strong momentum in either direction.
However, the recent crossover of the +DI above the -DI, with the +DI rising to 21.4 and the -DI at 15, shows that buying pressure has started to dominate over selling pressure. This setup indicates the early stages of a potential uptrend, although the weak ADX signals that the trend is not yet firmly established.

The Average Directional Index (ADX) measures the strength of a trend, regardless of its direction, on a scale of 0 to 100. Values above 25 indicate a strong trend, while readings below 20 suggest weak or absent trend strength. The +DI (Directional Indicator) tracks buying pressure, while the -DI tracks selling pressure.
With the +DI crossing above the -DI and showing a higher value, bullish momentum is beginning to build. However, for ETH’s uptrend to gain traction, the ADX would need to rise above 20 to confirm stronger trend momentum. In the short term, ETH may see gradual gains, but sustained upward movement will depend on an increase in overall trend strength.
ETH Price Prediction: A Potential 16% Upside
If a strong uptrend materializes, ETH price could test the resistance at $3,523, marking a significant milestone in its recovery efforts.
A breakout above this level could pave the way for further gains, with targets at $3,827 and potentially $3,987, a level ETH hasn’t tested since December 17.

On the other hand, if the current momentum fails to form a strong uptrend, Ethereum price could revisit support at $3,300, a level it tested on December 27 and December 30.
Failure to hold this support could lead to further declines, with the next targets at $3,218 and $3,096.
The post Ethereum (ETH) Price Gains Momentum as Indicators Hint at Bullish Shift appeared first on BeInCrypto.


