The Ethereum (ETH) price has faced a period of uncertainty, reflected in the behavior of both whales and net transfer volumes.
Throughout the past month, on-chain metrics have shown conflicting signals, with inflows and outflows to exchanges suggesting mixed investor sentiment.
ETH Net Transfer Volume Reflects Uncertainty
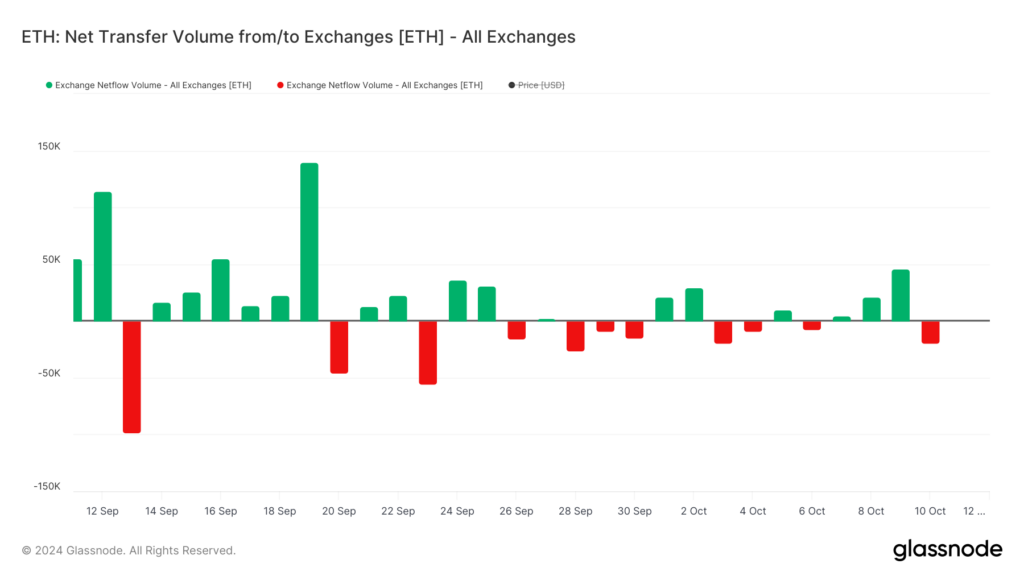
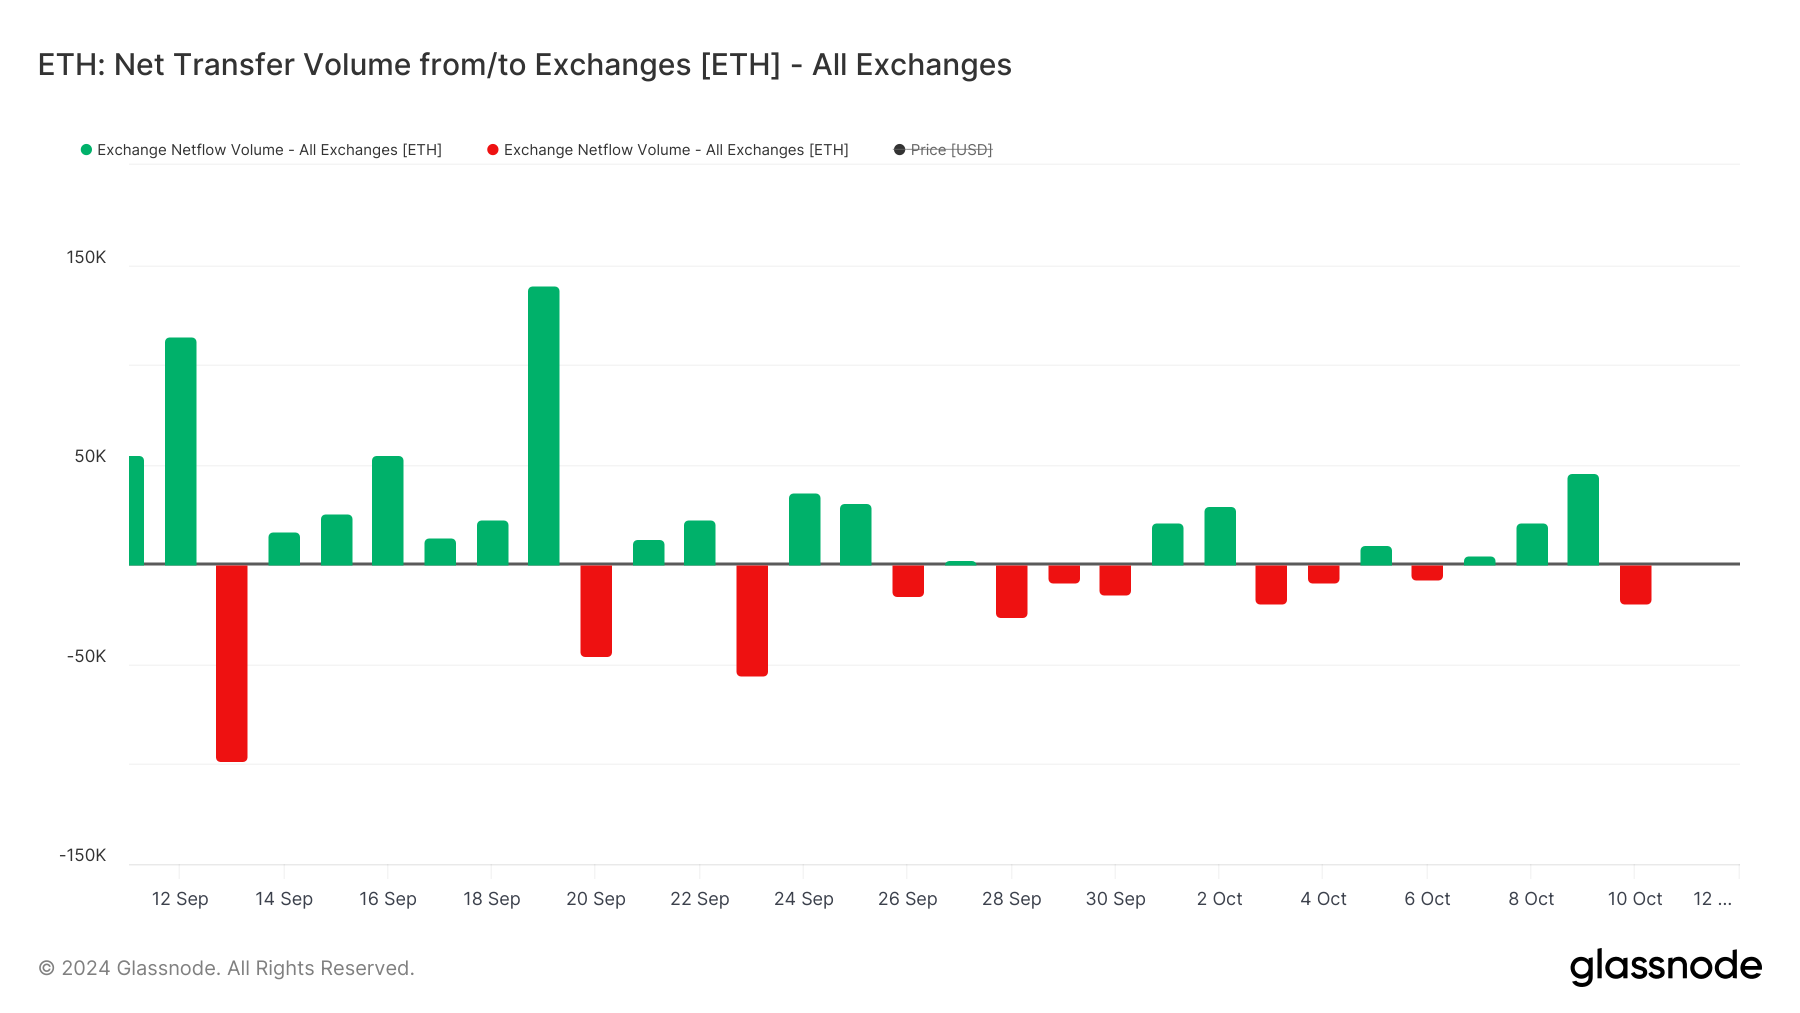
The net transfer volume of Ethereum to and from exchanges over the past month reflects a market struggling to find a clear direction. During this period, netflow reached a monthly high of 140,000 ETH on September 19, indicating a substantial inflow of ETH into exchanges.
This could signal increased selling pressure and bearish sentiment as investors prepare to liquidate their holdings. However, following this spike, netflow volumes have remained considerably lower, suggesting a reduction in selling pressure.
There were notable episodes of significant outflows, such as those in mid-September and early October, where investors moved large quantities of ETH away from exchanges. These outflows are generally considered bullish, as they indicate holders’ preference for long-term accumulation rather than immediate selling.
However, substantial inflows were also observed, such as on September 12, contributing to the overall uncertainty as they signal readiness for potential sell-offs.
Read more: Ethereum (ETH) Price Prediction 2024/2025/2030

This metric, which captures the net movement of ETH between exchange addresses and individual wallets, provides valuable insight into market sentiment: positive netflows suggest bearish inclinations as investors prepare to sell, while negative netflows (more ETH leaving exchanges) indicate bullish sentiment as holders opt to store their assets away from exchanges.
Between October 7 and October 9, the netflow remained positive for three consecutive days, which implies more ETH was entering exchanges — a bearish signal that investors could be getting ready to sell. This negative streak, however, ended on October 10, when netflows turned negative, with -19,000 ETH leaving exchanges.
The alternating inflows and outflows, combined with the lack of consistency in their magnitude, indicate a market that remains indecisive. This reflects investor hesitation about ETH and a sentiment that is neither fully committed to buying nor selling.
Are Ethereum Whales Losing Confidence?
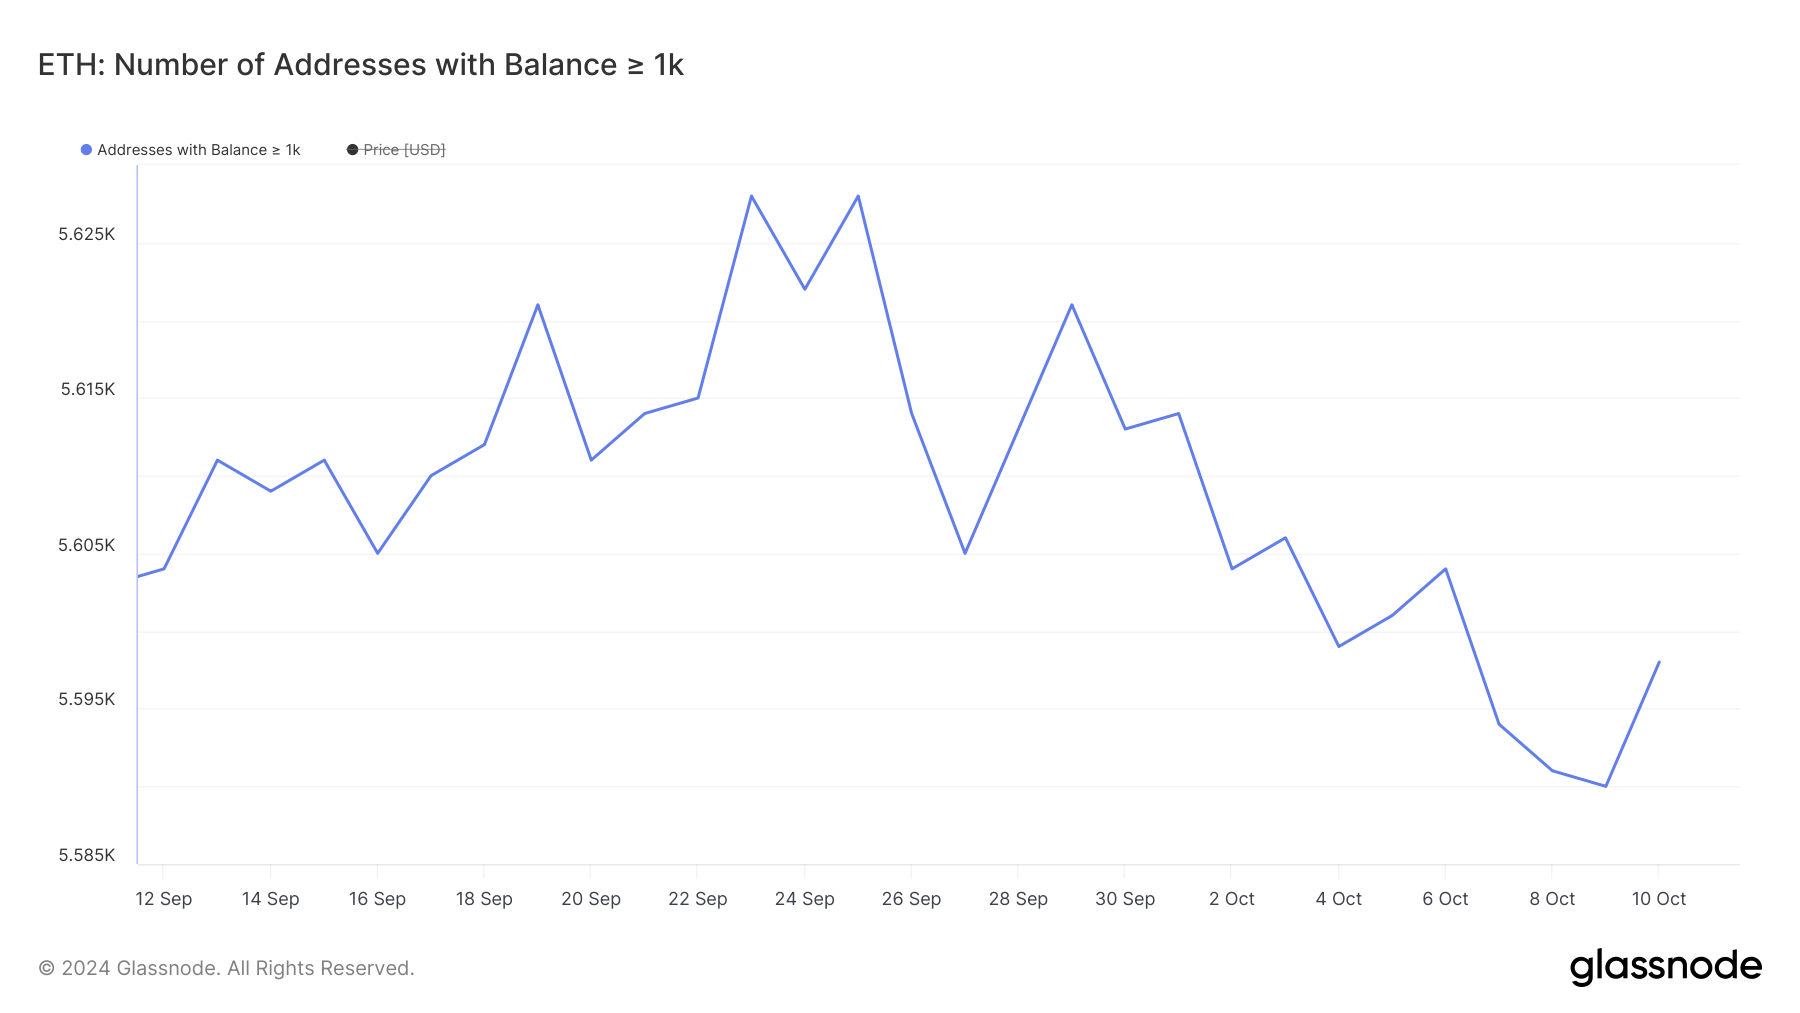
ETH whales remained hesitant during mid-September. Then, between the end of September and the beginning of October, the number of addresses holding at least 1,000 ETH started to drop significantly.
This trend reached a month-low on October 9, with just 5,590 addresses. The decline highlights a moment of uncertainty among large holders, indicating that major players were stepping back from significant ETH accumulation.
This hesitation among whales could reflect concerns over market volatility or a broader lack of confidence in ETH’s near-term potential. A decline in large holdings often precedes shifts in market sentiment, as whales have the capital power to move markets substantially.

Tracking the number of whale addresses is crucial because these addresses can meaningfully influence market dynamics. Whales are typically sophisticated investors or institutions, and their actions often provide insights into market direction.
When the number of whale addresses decreases, it can signal a loss of confidence in the asset. On the other hand, increasing whale activity can indicate accumulation phases, often seen as bullish signals.
Although there was an uptick between October 9 and October 10, bringing the count to 5,598, it remains well below the levels seen just a few weeks earlier. This suggests that whales may have lost confidence in ETH over the past few days and have yet to regain trust in a price rebound, reflecting a cautious stance despite the slight recovery.
ETH Price Prediction: Is ETH Downtrend About to Reverse?
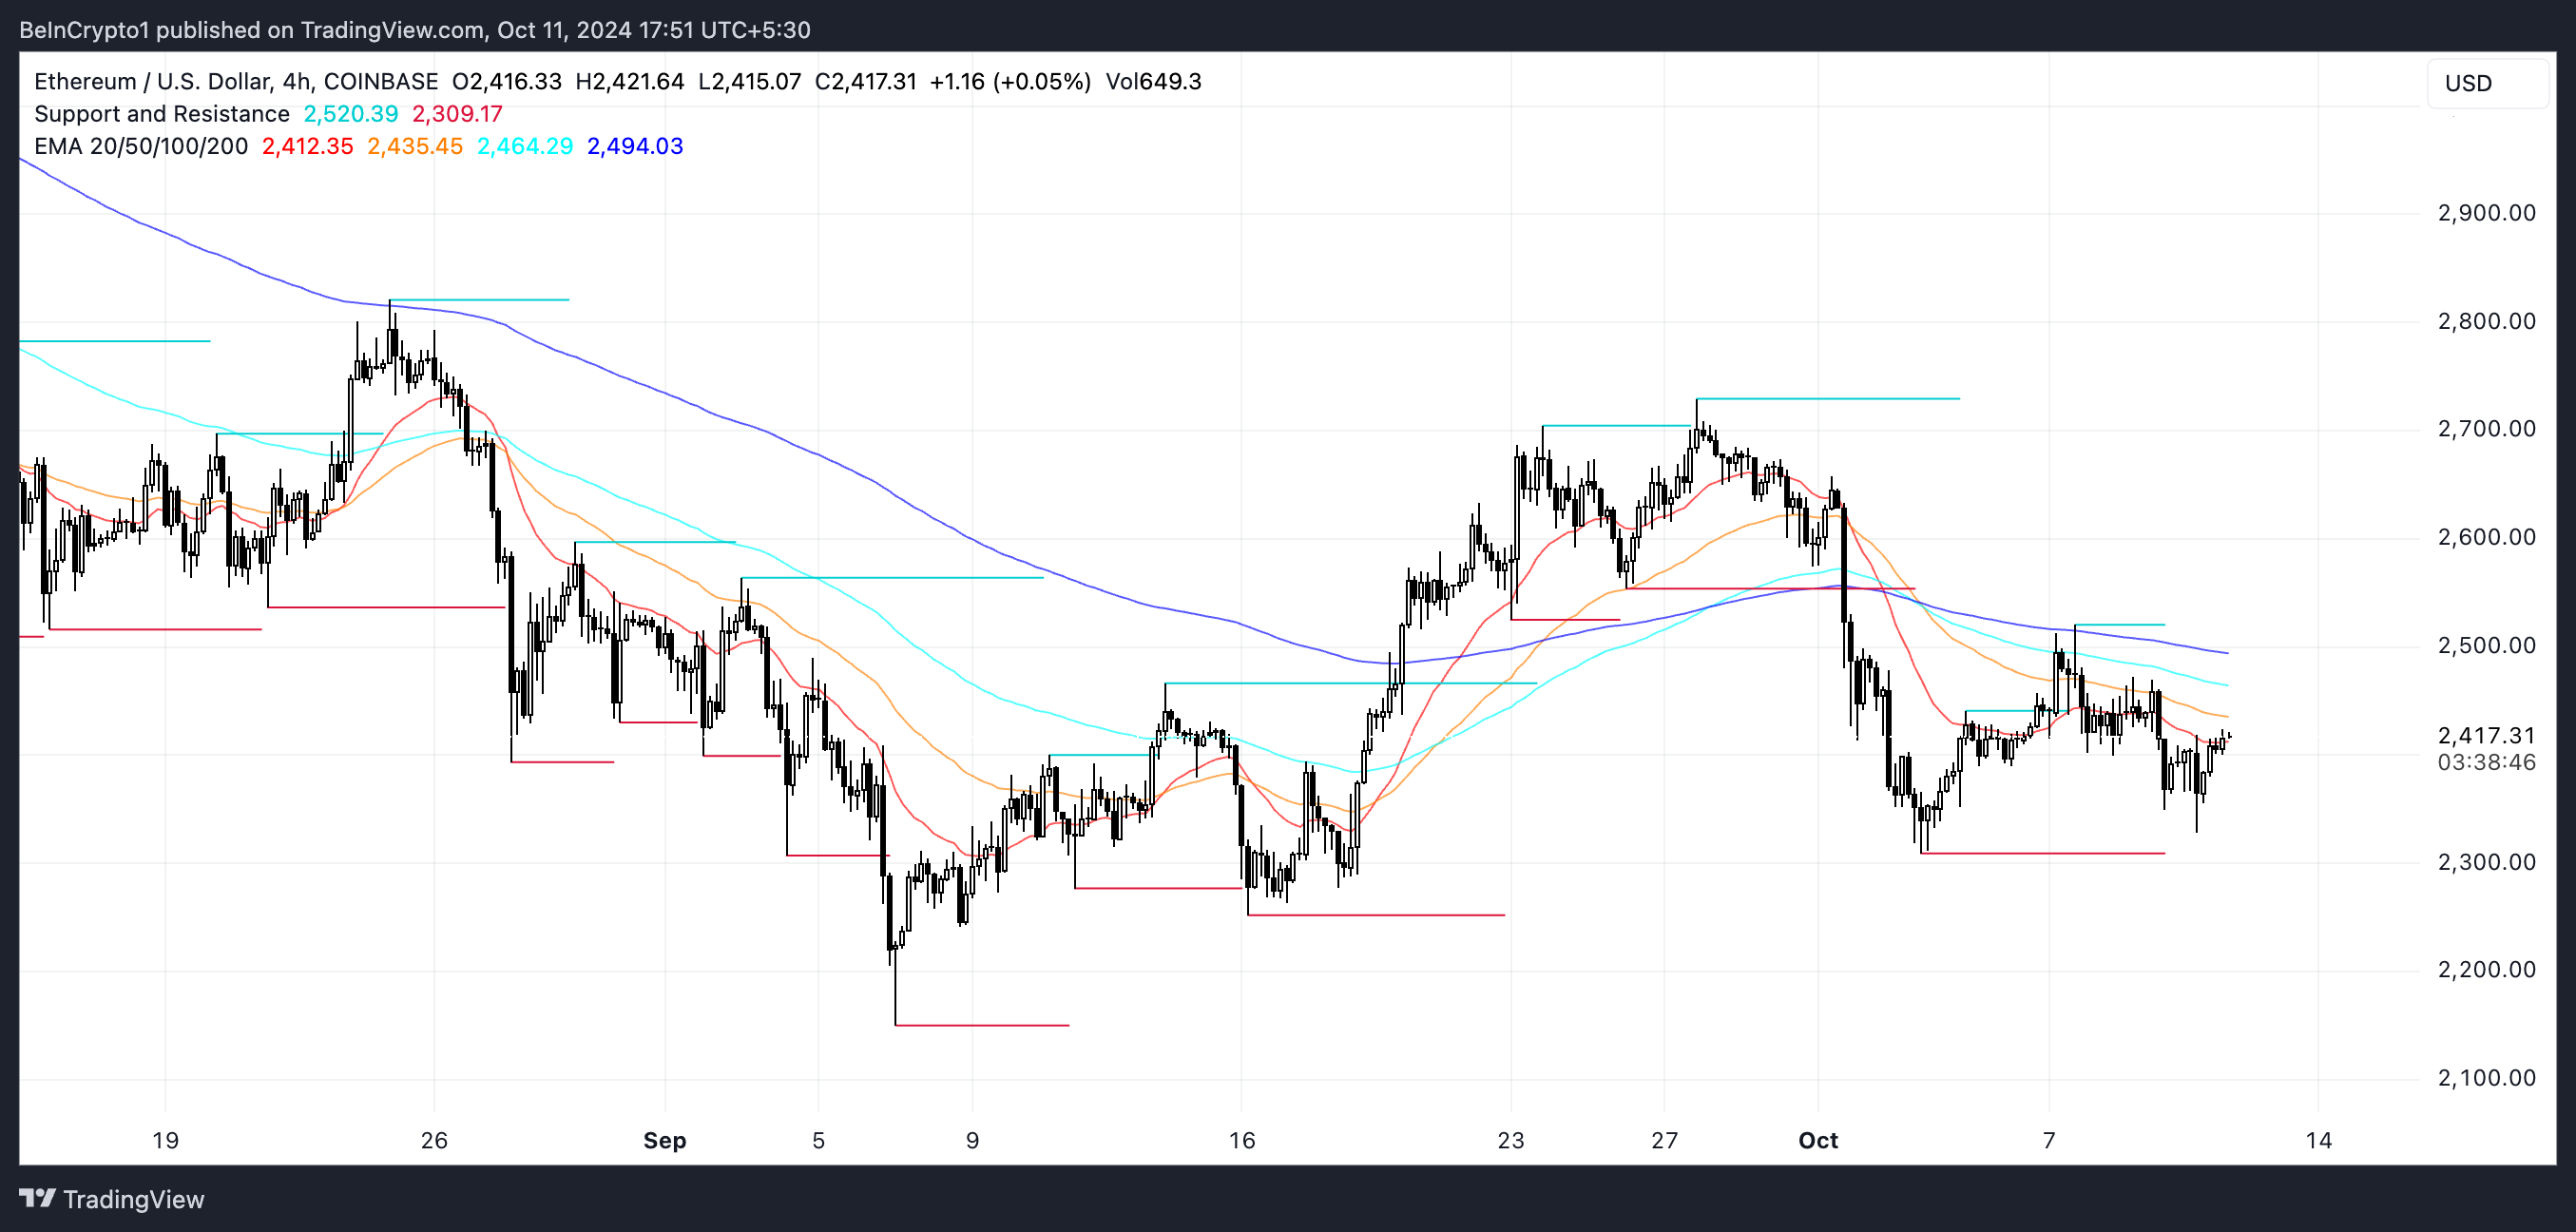
ETH’s Exponential Moving Average (EMA) lines are currently bearish, with short-term lines below long-term ones. However, one of the short-term EMAs has recently started to move upward. Although this is still a small change, it could suggest that ETH is attempting to reverse the ongoing downtrend.
EMA lines are a useful tool for identifying the overall trend by smoothing out price data, and the recent upward movement in the short-term EMA hints at a potential shift in market momentum. However, it is too early to tell if this marks the beginning of a sustainable uptrend or just a short-lived fluctuation.
Read more: How to Invest in Ethereum ETFs?

The EMA lines provide valuable insights into potential price movements. If the downtrend continues, ETH may test support levels at $2,308 or even $2,250, which would indicate further weakness. Conversely, if whale activity picks up and confidence returns, an emerging uptrend could see ETH price testing resistance levels at $2,467 and $2,563.
If the buying pressure is strong enough, ETH price could potentially reach $2,729, marking a 12% price increase. The direction of the EMA lines, combined with whale behavior, will be key to understanding whether ETH can break out of its current range and resume an upward trend.
The post Whale Movements Signal Uncertainty for Ethereum (ETH) Price appeared first on BeInCrypto.


