Aptos (APT), the layer-1 blockchain that employs the Move programming language, saw its token price increase by 17.32% in the last seven days.
At press time, APT’s price is $7.03, and it has been trading around the same area for the last 24 hours. This on-chain analysis explains why the price increased and the grounds for a possible downtrend in the coming days.
Higher Transactions Give Way for Aptos Price Jump
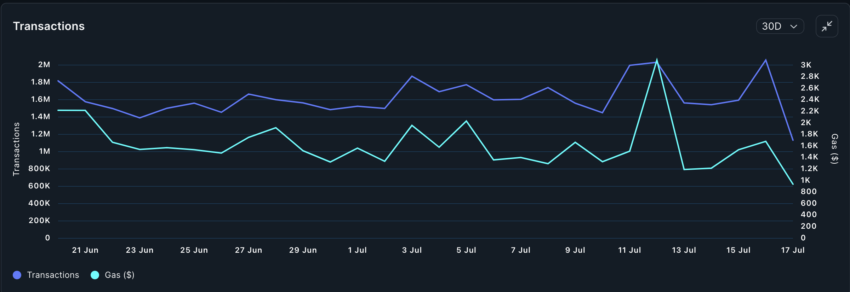
Aptos’s price increase is related to the significant rise in blockchain transactions. According to Nansen data, the network had over 2 million transactions as of July 16.
A rise in transactions usually means there is an increased level of buying and selling. However, heavy movements and sudden spikes, like with Aptos and the price increase, indicate that buying pressure was much greater than the volume of APT sold.
However, at press time, the number of transactions decreased to 1.13 million, indicating that the token’s popularity had dwindled.
Read More: 5 Best Aptos (APT) Wallets in 2024

Following the drop in transactions, traders’ sentiment around APT also changed. BeInCrypto got wind of this perception after checking the Funding Rate.
Funding Rate is the difference between the price of a perpetual contract and the spot price. The result from this gives an idea of the cost a trader is paying to keep a position open.
Apart from that, it indicates the sentiment market participants have about a cryptocurrency. If the Funding Rate is positive, it means that the perpetual price is trading at a premium to the index value. In this case, trader sentiment is bullish.
For Aptos, the Funding Rate as of this writing is negative, indicating that the perpetual price is at a discount and sentiment is bearish.

Should sentiment around APT remain bearish, demand may fall. In terms of the price, this can cause the value to keep swinging sideways or slide downwards in the short term.
APT Price Prediction: Is Reversal Imminent?
The technical perspective gives insights into how Aptos may perform going forward. According to the daily APT/USD chart, the Money Flow Index (MFI) stands at 84.19.
The MFI incorporates volume to track the flow of liquidity in and out of a cryptocurrency. If it increases, it means that money flow is increasing and could be vital to a price hike. However, a decrease suggests otherwise.
In the same vein, the MFI can be used to spot overbought and oversold levels. Readings above 80.00 indicate that a cryptocurrency is overbought, while those below 20.00 means it is oversold.

Considering the reading mentioned above, Aptos is overbought, and a price reversal could be on the cards. The Relative Strength Index (RSI), which measures momentum, also supports this.
From the chart above, we can see that the RSI has stalled, meaning that bullish control is no longer dominant.
Between July 1 and 5, APT experienced a 28.33% decrease. However, bulls successfully found support at $5.18, which led to a significant bounce. The chart below highlights how the token tried to approach $7.78 but was rejected.
Read More: Where To Buy Aptos (APT): 5 Best Platforms for 2024

Based on the analysis above, APT may be unable to break through $7.28. Instead, the next price point it could hit lies at $6.79.
However, the price may begin to increase if transactions on the Aptos network return to the peak mentioned above. The prediction could also be invalidated if buying pressure increases. If this happens, APT price may surpass $7.28 while eyeing $7.78.
The post Aptos (APT) Price Jumps 17% as Bulls Take Control appeared first on BeInCrypto.


