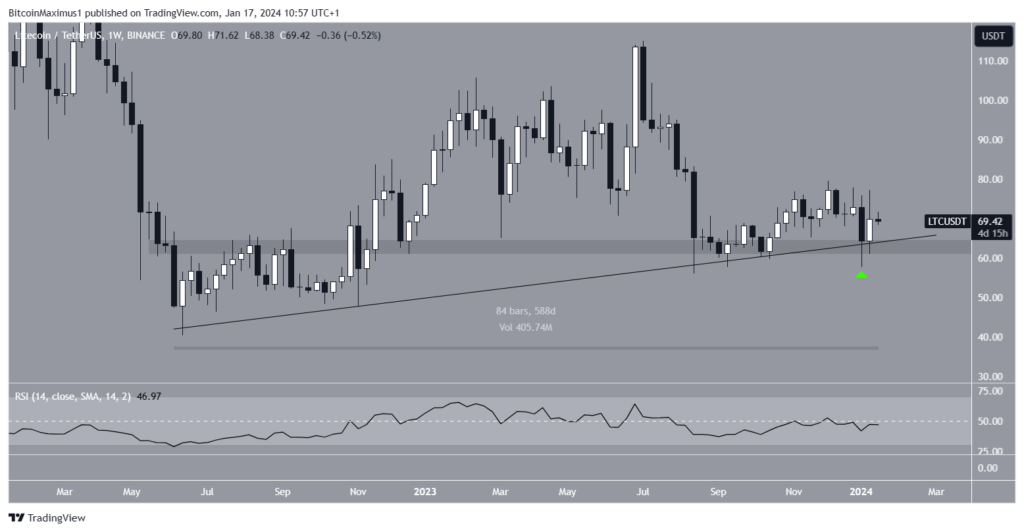
The Litecoin (LTC) price bounced at a long-term horizontal and diagonal support area last week.
The price has not begun a significant increase yet, though there are positive signs in lower time frames.
Litecoin Attempts to Bounce at Support
On the weekly timeframe, LTC’s price action shows a decline from its peak at $115 in July 2023. The drop led to a low of $56 in August. Following a brief rebound and subsequent decline, the Litecoin price created a higher low (green icon).
This bounce in Litecoin’s price confirmed a long-standing ascending support trend line. The trend line has existed for nearly 600 days and coincides with a horizontal area that has served as support and resistance.

Traders commonly employ the Relative Strength Index (RSI) as a momentum indicator to evaluate whether a market is in an overbought or oversold condition, guiding decisions to accumulate or sell an asset.
When the RSI surpasses 50, and the trend is upward, bulls retain an advantage; conversely, if the reading falls below 50, the opposite holds true. Currently, the weekly RSI stands at 50, indicating an undetermined trend.
Read more: 7 Best Litecoin (LTC) Wallets for 2023
Litecoin Mining Difficulty Reaches All-Time High
Today, the Litecoin team announced that the mining difficulty reached a new all-time high. This is a sign of network growth and increased maturity.

Additionally, the team announced that 18,000,000 ordinals have already been inscribed on the Litecoin network.
Read more: How To Buy Litecoin (LTC) in 4 Easy Steps
LTC Price Prediction: Has Price Started a Reversal?
Like the analysis of the weekly timeframe, the 2-day chart does not provide a clear confirmation of the trend’s direction. Still, the wave count leans towards a bullish scenario.
Elliott Wave theory, which involves studying recurring long-term price patterns and investor psychology, is utilized to discern the trajectory of a trend. The prevailing wave count implies completing a five-wave upward movement and an A-B-C corrective structure initiated in June 2022.
According to this scenario, Litecoin began another upward movement (white) in September 2023. LTC is anticipated to surge by 75% if these upward movements have the same length, reaching the next resistance level at $122.

Despite this bullish prediction for LTC’s price, it’s crucial to note that a dip below the September 2023 low of $57.30 (red) would negate the bullish count. In such a scenario, Litecoin might experience a 30% decline, finding support at $48.
For BeInCrypto’s latest crypto market analysis, click here.
![]()
Coinbase
Explore →
![]()
KuCoin
Explore →
![]()
Metamask Portfolio
Explore →
![]()
Wirex App
Explore →
![]()
YouHodler
Explore →
![]()
Margex
Explore →
Explore more
The post Litecoin’s (LTC) Price Stalls at $70 Amidst All-Time High Mining Difficulty appeared first on BeInCrypto.


