The Cardano (ADA) price bounced last week but failed to sustain the majority of its increase.
ADA attempts to break out from a descending resistance trend line that has been in place for 33 days.
Cardano Bounces After Breakout
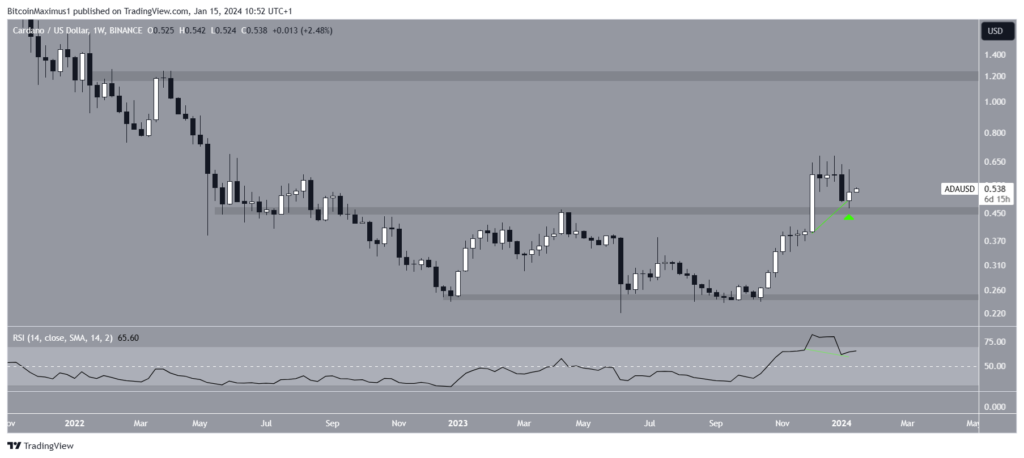
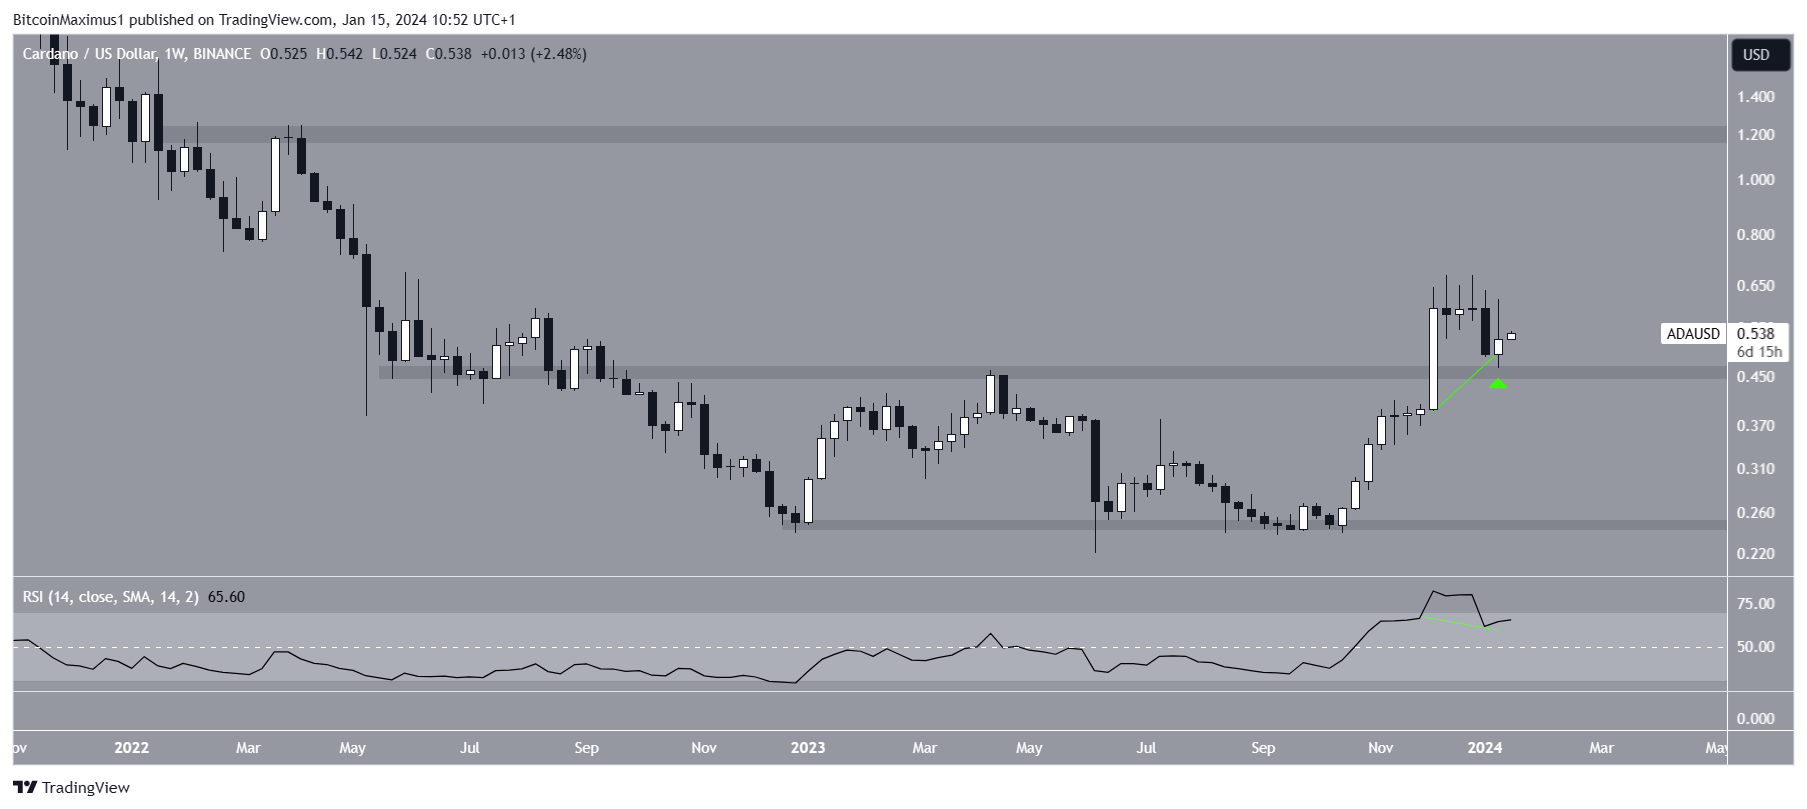
ADA has been trading within a horizontal range since November 2022, with support and resistance levels confirmed several times.
In October 2023, ADA initiated a swift upward movement, breaking out of the range the following month and reaching a new yearly high of $0.68 in December.
Although the Cardano price experienced a subsequent decline, it bounced in the range’s upper boundary last week. ADA closed the week bullishly but left a long upper wick in place.

Traders commonly utilize the Relative Strength Index (RSI) as a momentum indicator to identify potential overbought or oversold conditions and make asset accumulation or selling decisions.
RSI readings above 50 and an upward trend indicate a prevailing advantage for the bulls, while readings below 50 suggest the opposite.
The weekly RSI presents mixed signals – it is declining but remains above 50, indicating a hidden bullish divergence (green), a sign associated with the continuation of the current trend.
Read More: Best Cardano (ADA) Wallets
What do Analysts Say
While there is not a lot of chatter regarding ADA on X, some cryptocurrency analysts are bullish on the future trend.
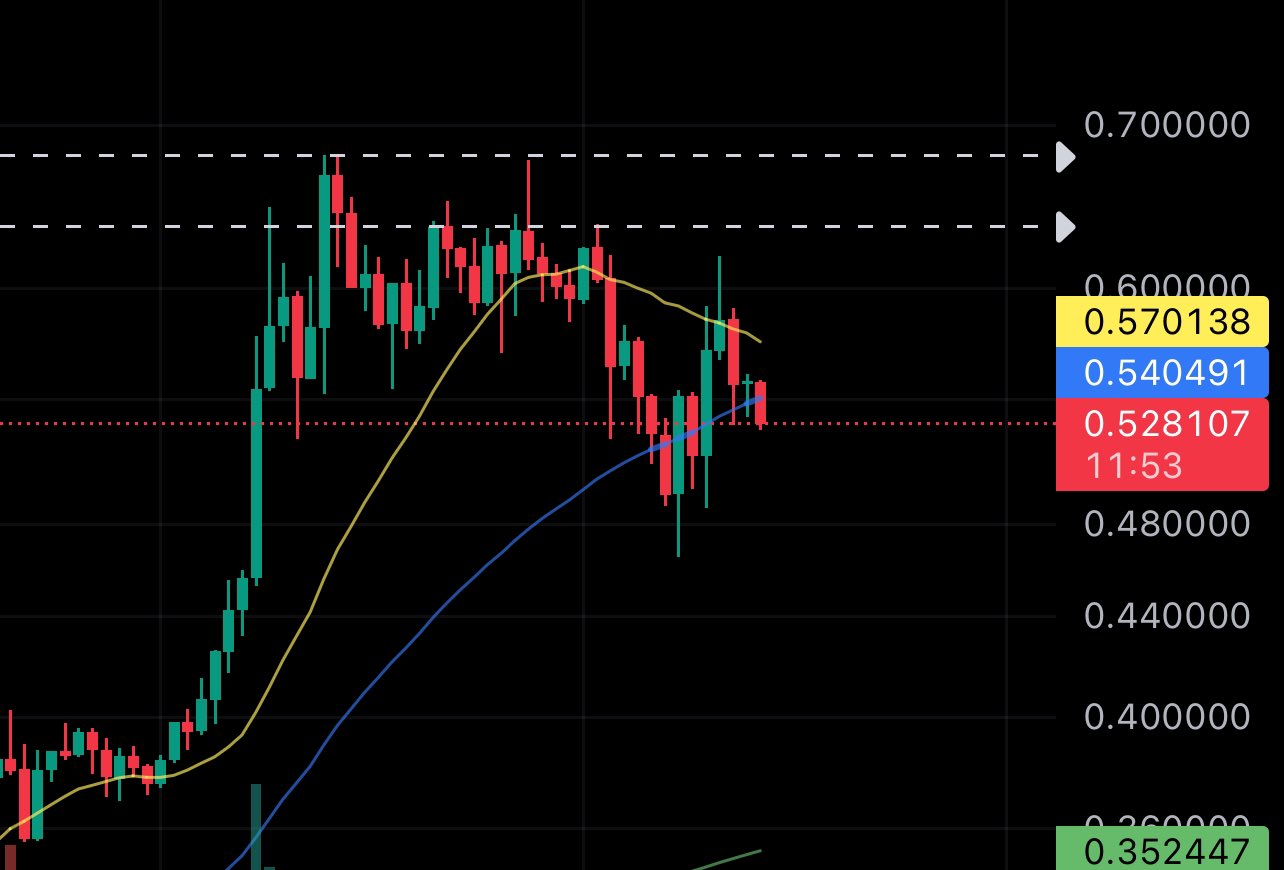
The dAppAnalyst believes that ADA will become parabolic after breaking out from $0.60-$0.70.

He also tweeted:
$ADA will 30-40x this cycle.
Many of you will see this and brush it off. 90% of people lose money in crypto because they don’t stick it out. Be the 10% and be patient. Food for thought.
ADA Price Prediction: Can ADA Break Through?
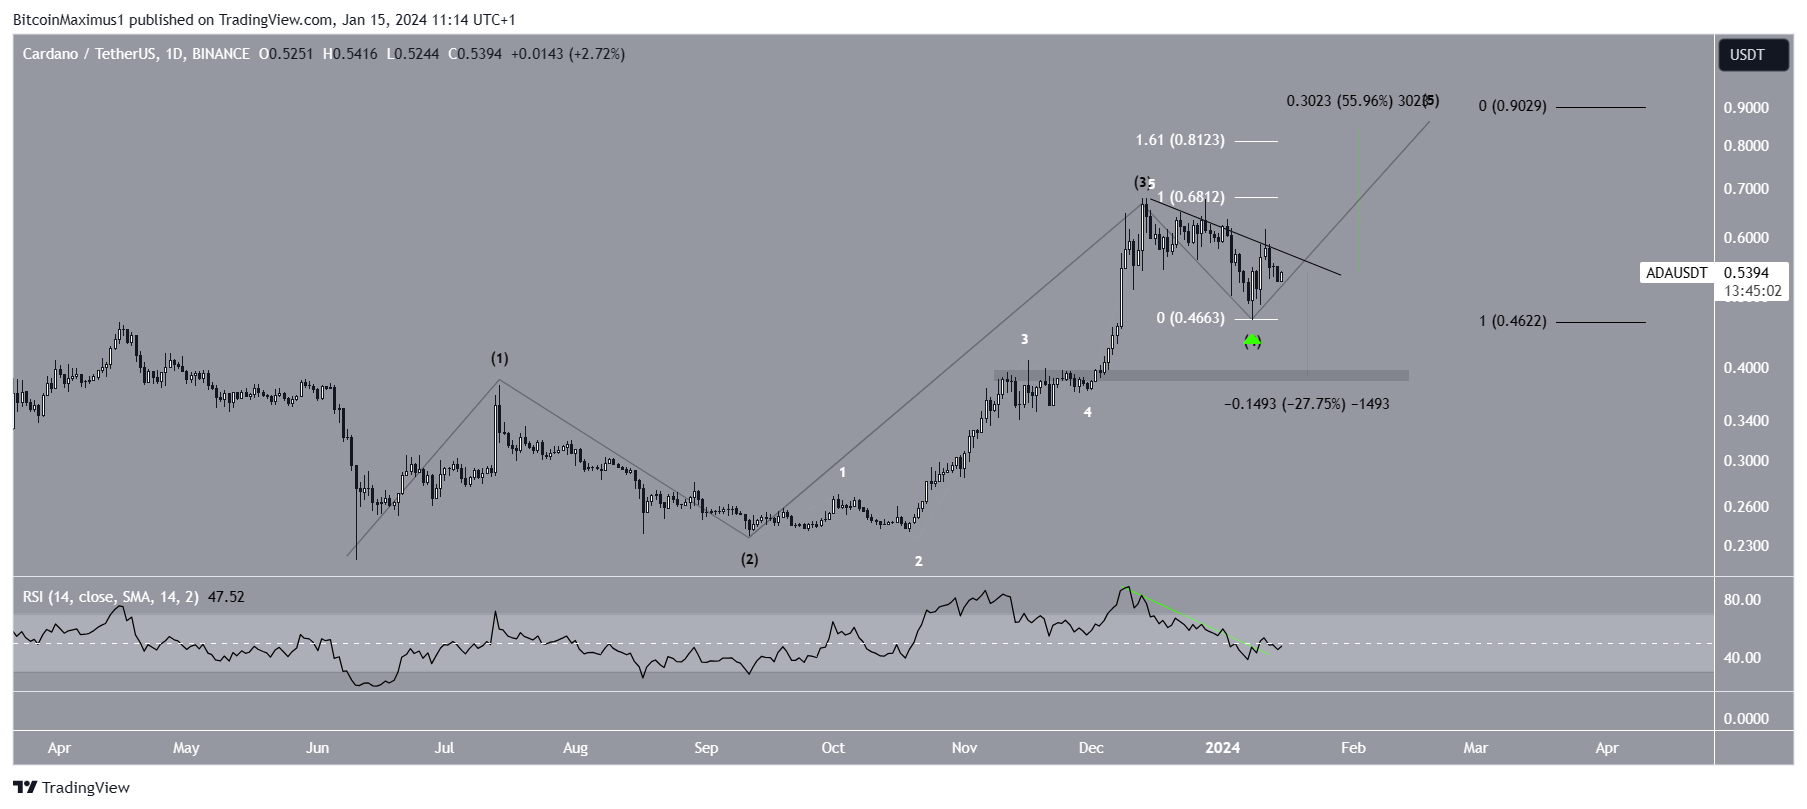
The daily time frame chart supports the continuing of the ADA price increase. The wave count and RSI readings both give signs of a bullish trend.
Technical analysts use the Elliott Wave theory to determine the direction of a trend, which involves studying recurring long-term price patterns and investor psychology.
The count suggests that ADA is in the fifth and final wave of its increase that began in June 2023 (black). Wave five started on January 8 (green icon).
Read More: How to Buy Cardano (ADA)
In order to confirm this count, ADA has to break out from its descending resistance trend line.
If this happens, ADA can increase 55% to the next resistance between $0.80-$0.90, created by the 1.61 external retracement of wave four (white) and the length of wave one (black).
The daily RSI aligns with this possibility since it has broken out from its trend line (green).

Despite this bullish ADA price prediction, falling below $0.46 will invalidate this count. Then, ADA can decrease by 28% to the closest support at $0.40.
For BeInCrypto’s latest crypto market analysis, click here.
Read More: How to Stake Cardano
![]()
Coinbase
Explore →
![]()
iTrustCapital
Explore →
![]()
Metamask Portfolio
Explore →
![]()
UpHold
Explore →
![]()
eToro
Explore →
![]()
BYDFi
Explore →
Explore more
The post Cardano (ADA) Hits Local Bottom – Price Targets $1 Next appeared first on BeInCrypto.


