The Polygon (MATIC) price bounced yesterday after the team announced a new upgrade on transaction fee calculations.
Despite the bounce, MATIC still trades inside a bearish pattern, which has existed for nearly 60 days.
Polygon Deviates Above Long-Term Resistance
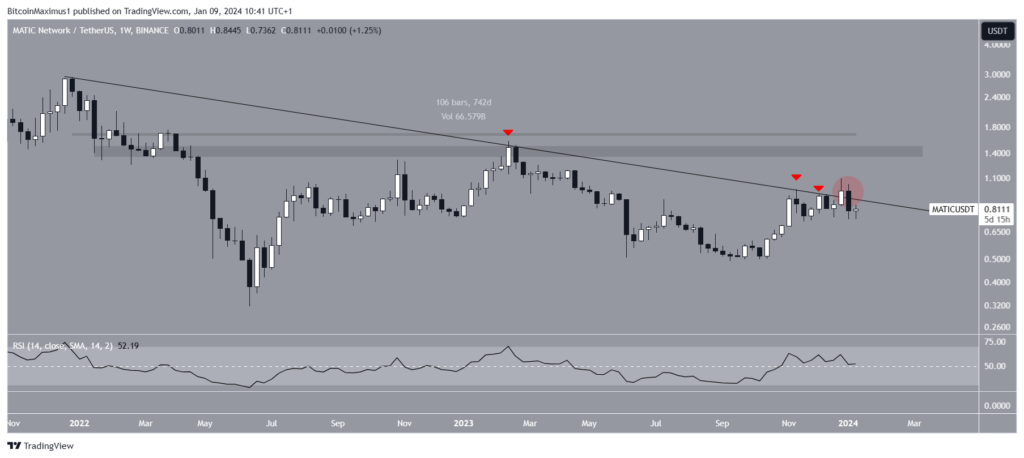
The MATIC price has experienced a decline below a long-term descending resistance trend line since December 2021, when it was trading at its all-time high of $2.90. This rapid descent led to a low of $0.32 in June.
Despite subsequent attempts at an upward movement, MATIC faced repeated rejections from the descending resistance trend line (red icons). MATIC finally broke out in December following three unsuccessful breakout attempts.
However, the breakout was illegitimate since the MATIC price created a bearish candlestick the next week (red circle), falling below the trend line again, which has been in place for more than 740 days.

Traders commonly employ the Relative Strength Index (RSI) to gauge momentum, identify overbought or oversold conditions, and guide decisions on buying or selling an asset.
The weekly RSI is above 50 but falling, mixed signs that point to an undetermined trend.
Read More: What is Polygon (MATIC)?
What Do Analysts Think?
Cryptocurrency traders and analysts on X have a bullish outlook on the future MATIC price trend.
Captain Faibik suggests a 600% rally is expected once the price breaks out from its long-term pattern.

Last week, the Polygon team announced a new upgrade for transaction fee calculations on the Polygon zkEVM.
The new mechanism uses the amount of execution in any given transaction and data availability to provide users with transaction fees that are more accurate and complete.
Read More: How to Buy Polygon (MATIC)?
MATIC Price Prediction: What to Make of Yesterday’s Bounce?
The daily time frame gives mixed readings because of the price action. Since November 2023, the MATIC price has traded inside an ascending parallel channel. This is considered a bearish pattern, meaning that it leads to breakdown most of the time.
MATIC has fallen since the channel’s resistance trend line rejected it on December 27. However, yesterday’s bounce saved a potential breakdown and created a bullish hammer candlestick (green icon).
The daily RSI is also undetermined since the indicator is at 50. So, whether MATIC breaks down from the channel or resumes its bounce can determine the future MATIC price prediction.

A breakdown from the channel can trigger a 19% decrease to the closest support at $0.65. On the other hand, a strong bounce can lead to a 40% MATIC upward movement to the channel’s resistance trend line at $1.16.
For BeInCrypto’s latest crypto market analysis, click here.
Top crypto platforms | January 2024
![]()
FXGT.com
Explore →
![]()
Bitrue
Explore →
![]()
Metamask Portfolio
Explore →
![]()
KuCoin
Explore →
![]()
Сoinex
Explore →
![]()
Kraken
Explore →
The post Will Polygon (MATIC) Price Move Above $1 After New Upgrade? appeared first on BeInCrypto.


