The Bitcoin (BTC) price is approaching its yearly high while the Crypto Market Cap (TOTALCAP) and Oasis Network (ROSE) already reached one.
In the news today:
- $1.1 Billion in Bitcoin options will expire today. There is a put/call ratio of 0.70, meaning there are more longs than shorts.
- BlackRock is finalizing its Bitcoin ETF details. Analysts maintain an optimistic chance of an ETF approval by January 10.
TOTALCAP Reaches New Yearly High
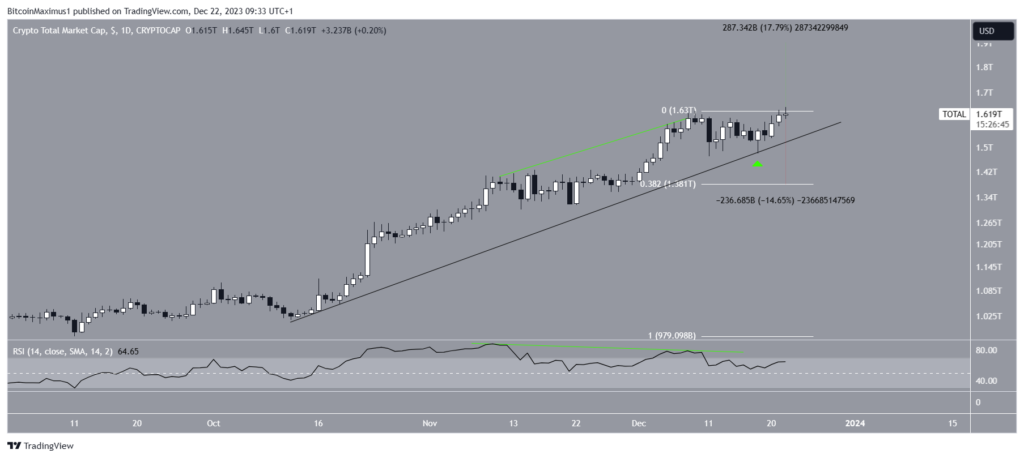
The cryptocurrency market cap has increased alongside an ascending support trend line since October. The upward movement led to a yearly high of $1.63 trillion on December 9.
Market traders use the RSI as a momentum indicator to identify overbought or oversold conditions and to decide whether to accumulate or sell an asset. Readings above 50 and an upward trend indicate that bulls still have an advantage, whereas readings below 50 suggest the opposite.
The decrease was preceded by a bearish divergence (green) in the daily RSI. A bearish divergence occurs when a momentum decrease accompanies an increase in value. It often leads to bearish reversals, as was the case with TOTALCAP.
However, TOTALCAP regained its footing with a strong bounce on December 18 (green icon). The ensuing increase led to a new yearly high of $1.65 trillion today.
If the upward movement continues, TOTALCAP can increase by another 18% and reach the next resistance at $1.90 trillion.

Despite this bullish TOTALCAP prediction, a breakdown from the ascending support trend line will likely lead to a fall of 15% to the 0.382 Fib retracement support level at $1.38 trillion.
Read More: 7 Must-Have Cryptocurrencies for Your Portfolio Before the Next Bull Run
Bitcoin Trades in Channel
Like TOTALCAP, the BTC price has increased alongside an ascending support trend line since October. The upward movement culminated with a new yearly high of $44,729 on December 8.
After an initial decrease, the BTC price bounced at the support trend line on December 11. Since then, it has increased inside an ascending parallel channel, considered a corrective pattern.
Currently, BTC trades at this channel’s resistance trend line. Whether it breaks out or gets rejected will likely determine the future trend.

A BTC breakout can lead to a 12% increase to the next resistance at $48,800. On the other hand, a breakdown can cause a 14% drop to the 0.382 Fib retracement support level at $37,800.
Read More: 9 Best Crypto Demo Accounts For Trading
ROSE Clears Long-Term Resistance
The ROSE price has increased swiftly since the middle of October (green icon). It has created eight bullish weekly candlesticks in ten weeks.
ROSE cleared the $0.08 and $0.11 horizontal resistance areas during the upward movement, leading to a new yearly high of $0.12 today.
If ROSE closes above the $0.11 area, it can increase by 90% to the next resistance at $0.22. The weekly RSI supports this possibility since the indicator is increasing and is above 70.

Despite this bullish ROSE price prediction, a close below $0.11 could trigger a potential 35% drop to the closest support at $0.08.
For BeInCrypto‘s latest crypto market analysis, click here.
Read More: Best Upcoming Airdrops in 2023
Best crypto platforms in Europe | December 2023
![]()
KuCoin
Explore →
![]()
Wirex App
Explore →
![]()
Bitsgap
Explore →
![]()
YouHodler
Explore →
![]()
Margex
Explore →
Explore more
The post Why Is the Crypto Market Up Today? appeared first on BeInCrypto.


